Practical Example#
To illustrate postprocessing, we will use the results from the previous section on picking ribosomes. The results below are in reference to the full tomogram, but extend similarly to the subset.
Obtaining a Particle List#
Recall the output of the previous template matching run, the peaks are fairly wide, well-separated, and most likely include some false-positive results.
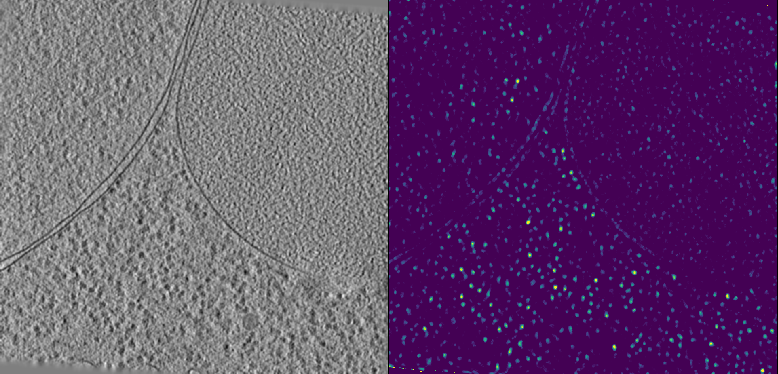
pytme defines a variety of peak calling mechanisms; the appropriateness depends on the specific use case. PeakCallerScipy is appropriate for the case above. If the setting was more crowded, PeakCallerMaximumFilter should yield better results. Running the code below will identify no more than 1,000 peaks using PeakCallerScipy and write them to orientations.tsv.
postprocess.py \
    --input-file output_default.pickle \
    --output-prefix orientations \
    --output-format orientations
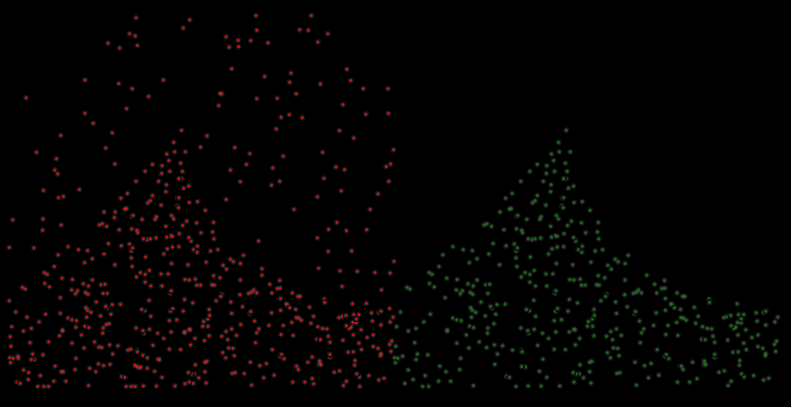
Peaks can be imported into the GUI using the Import Point Cloud button. We can change the color of the points to their relative scores by setting Color to Score. A 2D projection of the point cloud is shown below. While some peaks are correctly identified in the center, we note that many are too tightly packed and clustered around the tomogram borders. Inflated scores at the tomogram borders are a common occurence and arise due to artifacts from reconstruction and padding during template matching.
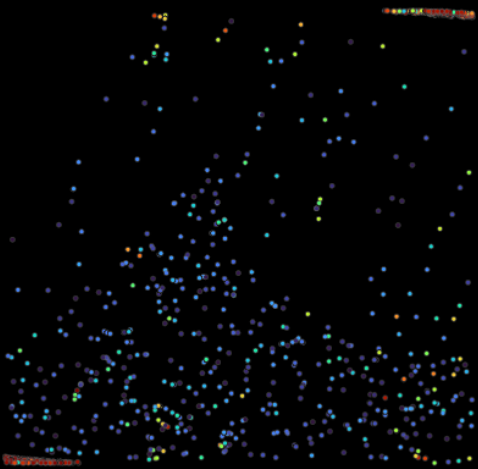
We can avoid the errors seen on the left by specifying a minimum distance between the peaks and masking the edges of the tomogram, effectively eliminating all scores that were computed using padding. Edge masking is done based on the shape of the template. For heavily zero-padded templates, users might want to specify the exact distance from the edges using --min-boundary-distance.
postprocess.py \
    --input-file output_default.pickle \
    --output-prefix orientations_distance \
    --output-format orientations \
    --min-distance 15 \
    --mask-edges
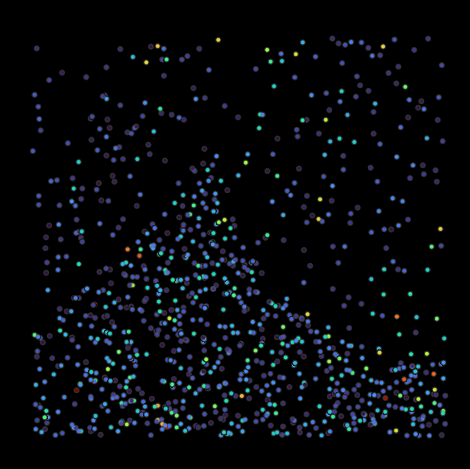
Adding distance constraints and edge masking lead to a better distinction between peaks and removed erroneous matches from the boundaries. However, since we did not impose any requirements on the minimal score or number of peaks, we now pick up a considerable amount of low scoring particles. We can specify an upper limit for the number of peaks, define bounds on the minimum and maximum score or automatically determine a suitable cutoff
postprocess.py \
    --input-file output_default.pickle \
    --output-prefix orientations_distance_score \
    --output-format orientations \
    --min-distance 15 \
    --mask-edges \
    --n-false-positives 5
Refinement#
The steps shown above should yield a suitable dataset for subsequenty classification, refinement, and averaging for the majority of cases. However, there are additional means to obtain a purer dataset.
Masking#
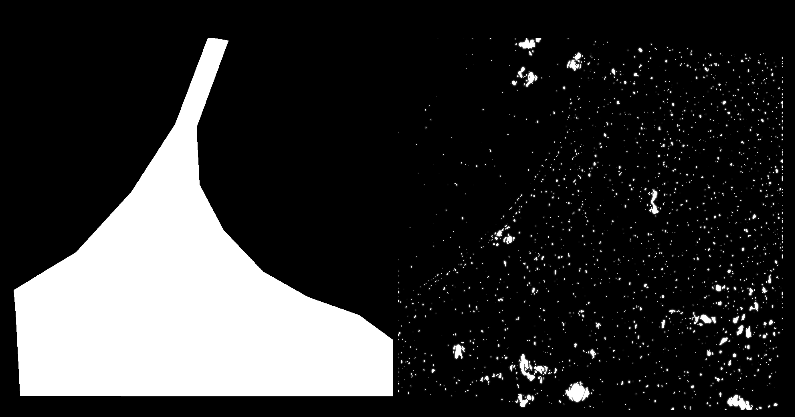
The GUI can be used to define a target mask, specifying which regions should be considered from the target. To do so, create a new Shapes layer in the GUI and press P to create a polygon that encapsulates your region of interest. Select the tomogram you want to mask and “Shape” from the Choose Mask tab before clicking Create Mask to propagate the polygon shape through the remaining axis. Alternatively, you can select “Threshold” from the Choose Mask tab to mask elements that deviate significantly from the average density in the tomogram. An example mask projection obtained using both approaches is shown below
Manual#
The GUI can also be used to exclude erroneous picks. Locate the layer controls in the top-left and use the Select Points tool. Select points you want to exclude and press the delete key to remove them. You can also add picks that were not considered before using the Add Points. However, their angular orientation will be trivial. Once you have sufficiently filtered your picks, use Export Point Cloud to create a final orientations file for further analysis.
Background Correction#
We can pass a --background-file to postprocess.py that corresponds to a template matching run obtained using a different template. By cross-referencing high-scoring peaks between both we can exclude the ones occuring in both datasets, thus removing high-scoring peaks that are not specific to our template of interest. While using a different macromolecule as a template typically yields superior results, you can also rerun match_template.py and simply add the --scramble-phases flag to acquire an approximation of the background.
Validation#
The final picks obtained using distance constraints and score cutoffs are shown below on the left. The right-hand side show the final picks obtained by passing a target mask to postprocess.py.
Comparing the final picks to ground truth picks reveals 90% [335 / 398] accuracy. However, due to the template’s spherical shape and the lack of high-resolution features, the angular assignment accuracy will be suboptimal (The topic is futher explored in [1]). This can be visually assessed by computing an average based on the angles from template matching. Angular accuracy can be principally improved by more elaborate reconstruction workflows considering the 3D CTF, less binned tomograms in template matching, or on the fly during refinement.