Concepts#
This section introduces the fundamental concepts behind Mosaic and explains the main components of the user interface.
UI Layout#
The Mosaic interface consists of several key components:
Menu Bar: Access to file operations, view settings and help (on macOS its in the top menu)
Tab Bar: Switches between major functional areas
Segmentation: Work with point cloud data and analyze object properties
Parametrization: Create and operate on mathematical models
Intelligence: Advanced features (Dynamically Triangulated Surface simulations, constrained template matching, membrane segmentations)
Ribbon Toolbar: Context-specific tools for the active tab
Object Browser: Lists and manages loaded data with:
Visibility indicators with data types
Context menus for operations
Editable names
3D Viewport: Main visualization area with:
Navigation controls
Orientation indicators
Optional coordinate axes
Status Bar: Shows interaction mode, target, and processing status (see below)
Additional dock widgets such as the Volume Viewer will be displayed at the bottom of the window.
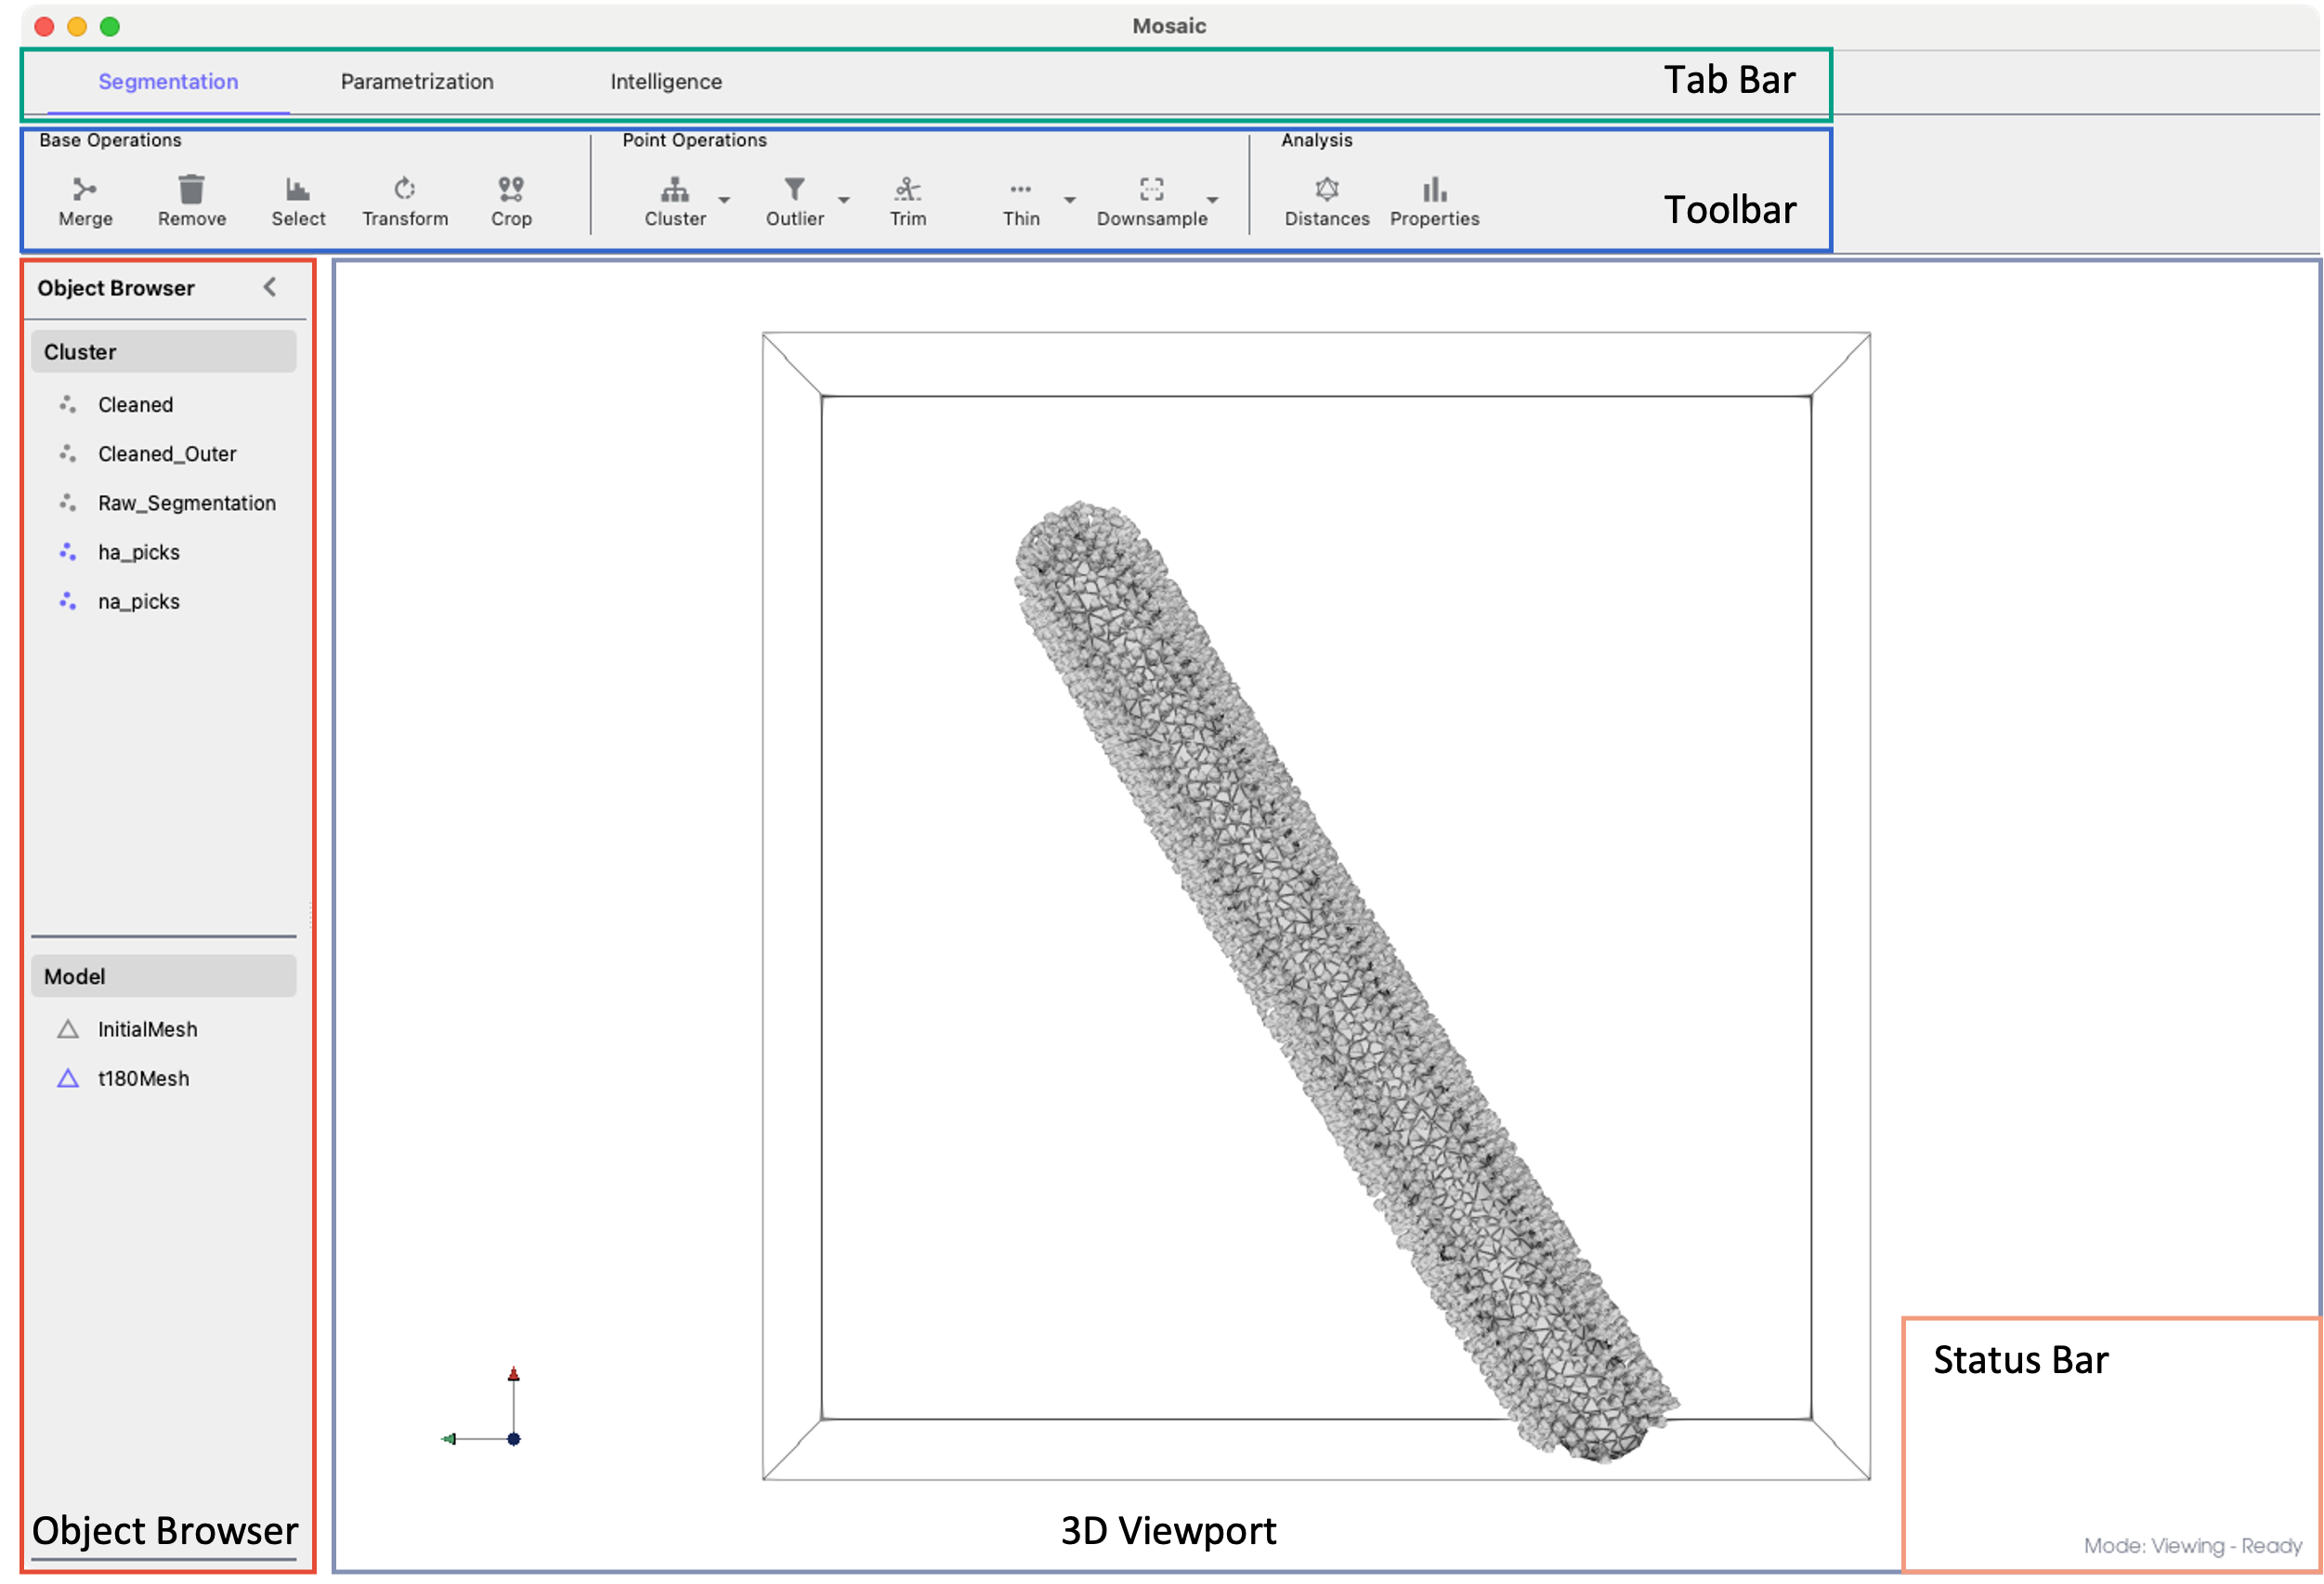
Mosaic interface layout.#
Object Browser#
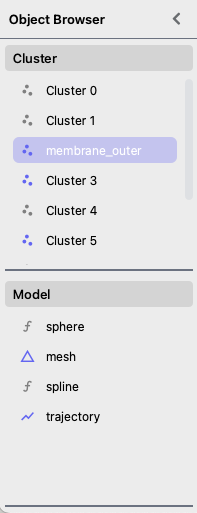
Object Browser#
The Object Browser is your central hub for managing all data in Mosaic. It displays all loaded objects in two main categories:
Clusters: Point cloud objects, e.g. a segmentation, where each point is defined by:
Position vector (X, Y, Z coordinates)
Unit quaternion to describe orientation (scalar-first w, x, y, z)
Models: Geometric shapes and surfaces including:
Fitted primitives (spheres, ellipsoids, cylinders)
Triangulated meshes
DTS simulation trajectories.
The symbol next to each object indicates the data type. The color of the symbol indicates if the object is shown or hidden.
Single click: Select one object
Double click: Edit object name
Ctrl+click: Add to selectionCtrl+A: Select all objectsShift+click: Select range
The search field at the top can be used to filter objects in both categories simultaneously.
Context Menu#
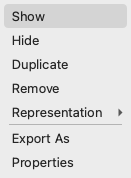
Context menu with options#
Right-click any object in the Object Browser to access:
Show/Hide: Toggle visibility
Duplicate/Remove: Copy or delete objects
Group/Ungroup: Group collections of objects
Representation: Modify how objects appear
Export: Save to various formats
Properties: Set rendering properties.
Status Bar#
The status bar at the bottom of the window displays three key pieces of information:
Interaction Mode#
Shows the current interaction mode (e.g., Viewing, Selection, Drawing). The cursor shape also reflects the active mode.
Tip
Exit any mode by pressing its activation key again or Esc. Modes can also be activated via Actions in the menu bar.
Viewing Mode (Default)
Default camera navigation mode
Use mouse to rotate, pan, and zoom the 3D viewport
Press
Escto return to viewing mode from any other mode
Area Selection — Press r to activate rectangular selection mode. Click and drag to select points within a rectangular area. Press e to expand selection to entire connected clusters.
Point Drawing — Press a to activate drawing mode. Click anywhere in the 3D viewport to add new points. If no cluster is selected, a new one is created automatically.
Curve Drawing — Press Shift+A to activate curve drawing mode. Click to place points along a curve path. Press Enter to save the curve as a new cluster.
Object Picking — Press E to activate object picking mode. Click directly on objects to select them. Selected objects are highlighted in the Object Browser.
Mesh Delete — Press q to activate mesh face selection mode. Click on triangular faces to select them, then press Delete to remove.
Mesh Add — Press Q to activate mesh addition mode. Click on three points to create a new triangular face.
Interaction Target#
Indicates whether picking operations apply to Clusters or Models. Press s during object picking to switch targets.
Processing Indicator#
Shows Idle when no tasks are running or Busy with an animated spinner during background operations. Click the indicator to open the Task Monitor, which displays:
Running: Currently executing tasks
Queued: Tasks waiting to start
Completed: Successfully finished tasks
Failed: Tasks that encountered errors
Expand any task to view its output. Use Clear Finished to remove completed and failed tasks from the list.
Coordinate System#
Mosaic does not handle spatial units internally. Instead, imported data is immediately transformed into a consistent reference frame based on the sampling rate (typically Ångstroms for molecular data). This sampling rate is provided by the user or can be extracted from the header of particular file formats, e.g., mrc files.
Assuming a segmentation is loaded from an mrc file with a sampling rate of 6.80 Ångstroms per voxel, Mosaic will multiply the voxel coordinates with the sampling rate. Therefore, the internal scale would be in Ångstroms. The sampling rate also affects:
Display size
Filtering operations
Distance measurements
Export operations
Mosaic uses a right-handed coordinate system:
X-axis: Horizontal (left to right)
Y-axis: Vertical (bottom to top)
Z-axis: Depth (back to front)
The standard orientation is (0, 0, 1).
Next Steps#
Now that you understand the basic concepts and layout of Mosaic, proceed to the Working with Data section to learn how to handle different data types.